View the Request Summary Dashboard
The Request Summary Dashboard shows several data points at a glance. From any of the bar, column, pie, and line charts, you drill down to get the information you need. You can also export the data to a PDF to save and share the data.
To view the Request Summary Dashboard:
Select Reports > Summary Dashboard.
To filter your results:
You can show a subset of data by clicking a section of either a pie chart or graph. All information within the report adjusts accordingly.
You can also use the filters on the upper-left side of the page. Click Filter to see them.
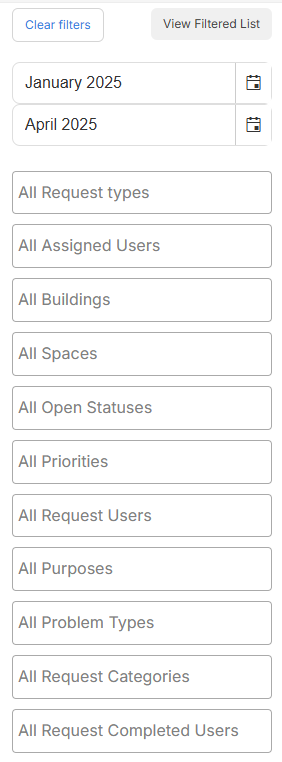
Click the filter you want, and then select from the drop-down.
|
Note:The date filter defaults to the last three months. Data is available the past 15 months. |
The filtered results appear in all charts and graphs.
To save and share a filter:
- At the bottom of the Report Filtering pop-up, type a name for your filter.
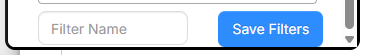
- Click Save Filters.
- To share the filter with a user who has the Enhanced Reports Administrative Permission, click Share filter.

- Search for the user.
- Click Save.
The Request Summary Dashboard includes:
| Data | Related widget |
|---|---|
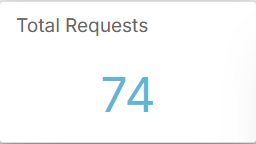
| Number of total requests |
|
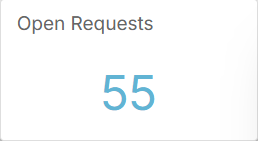
| Number of open requests |
|
| Number of closed requests |

|
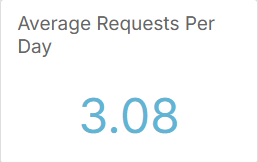
| Average requests submitted per day |
|
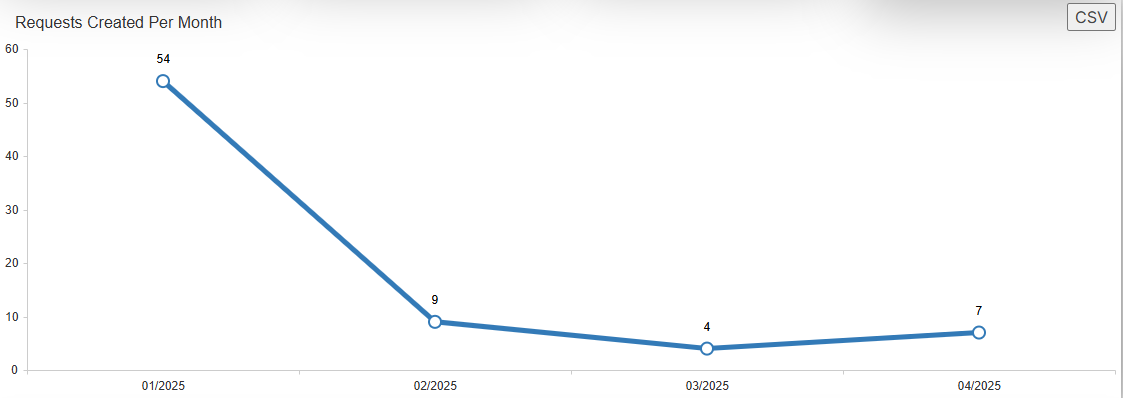
| Requests created per month |
|
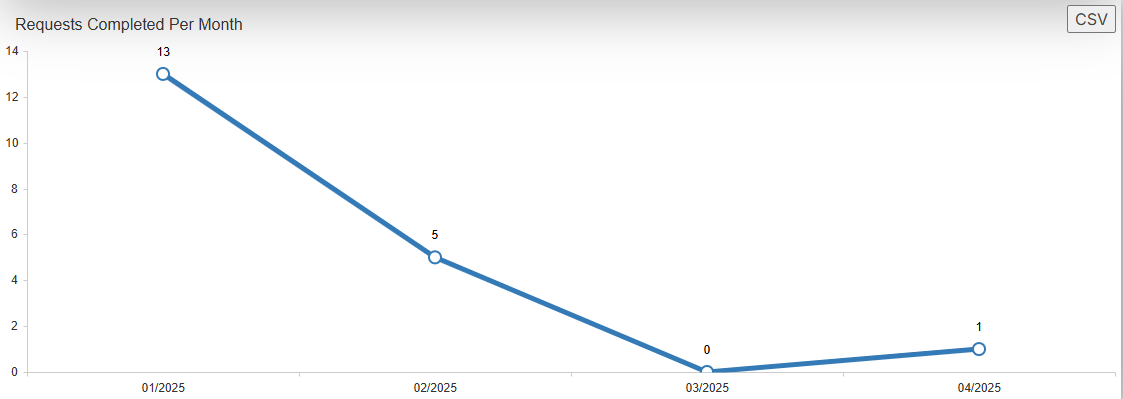
| Requests completed per month |
|
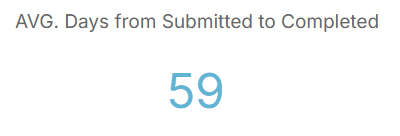
| Average days from submitted to completed |
|
| Average days from assigned to completed |

|
| Average hours from submitted to completed |

|
| Average hours from assigned to completed |

|
| Requests by request type |
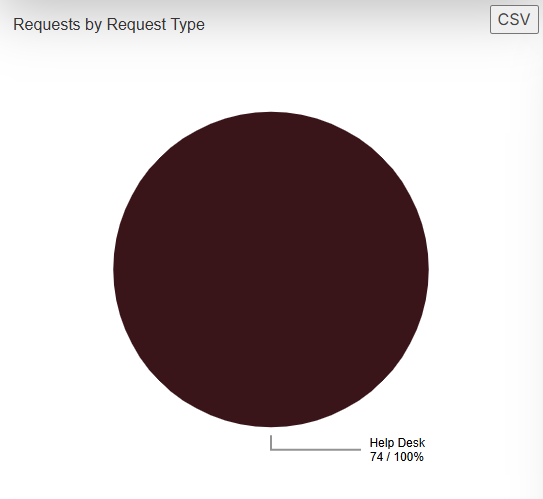
|
| Requests by status |
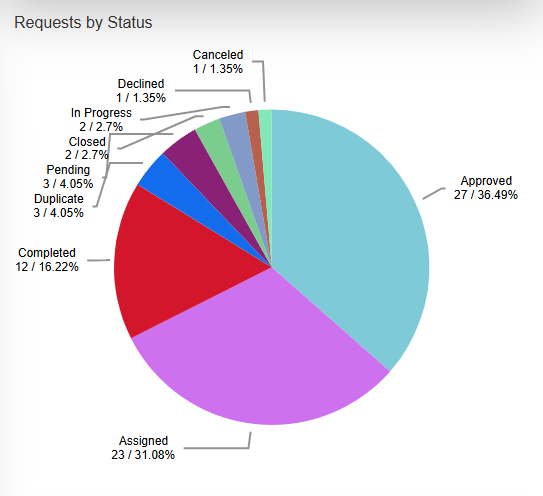
|
| Submitted requests by building |
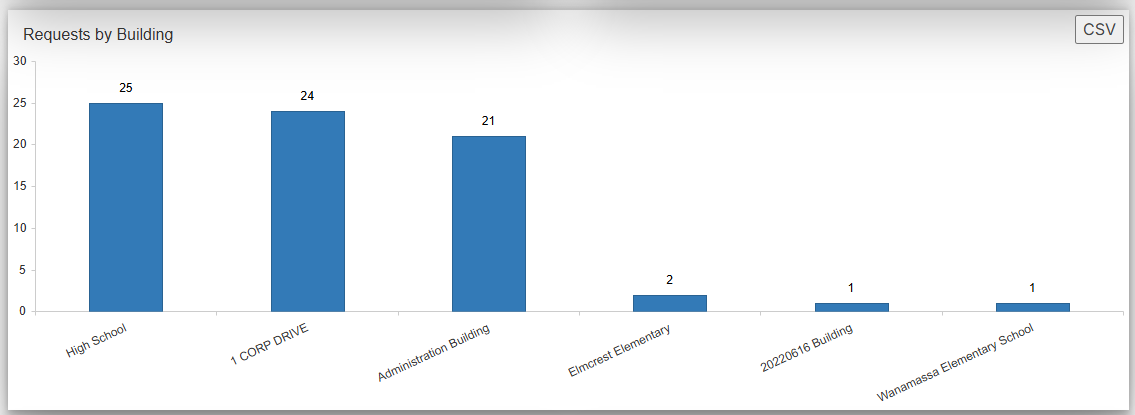
|
| Requests assigned per user |
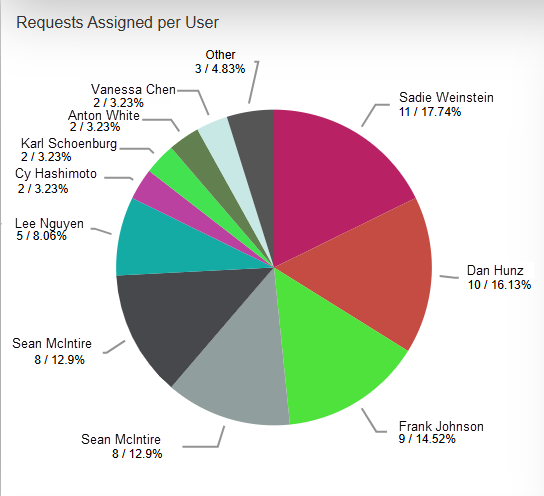
|
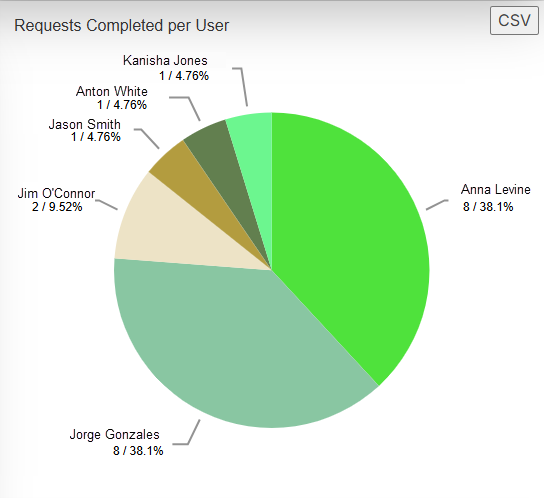
| Requests completed per user |
|
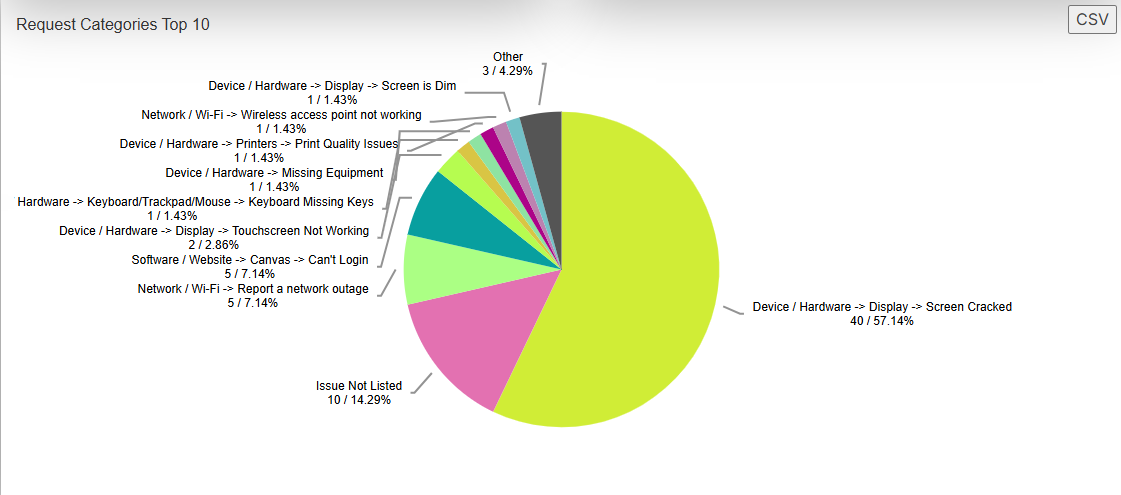
| Top 10 request categories |
|
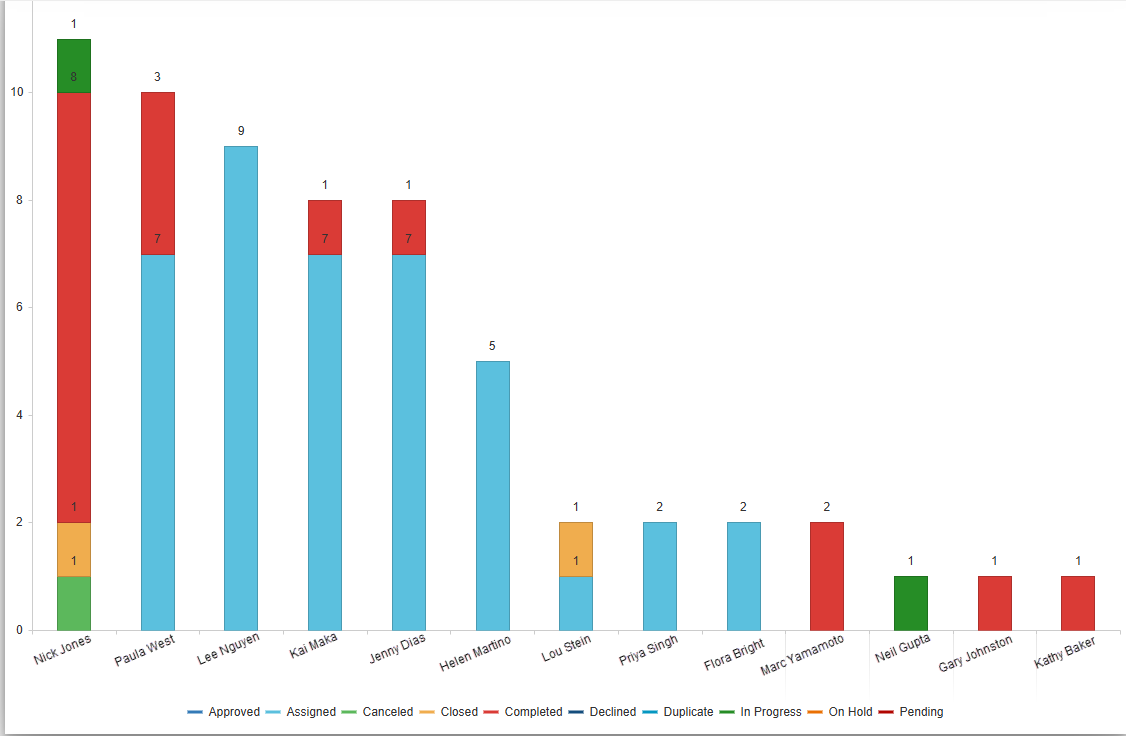
| Requests assigned per user |
|
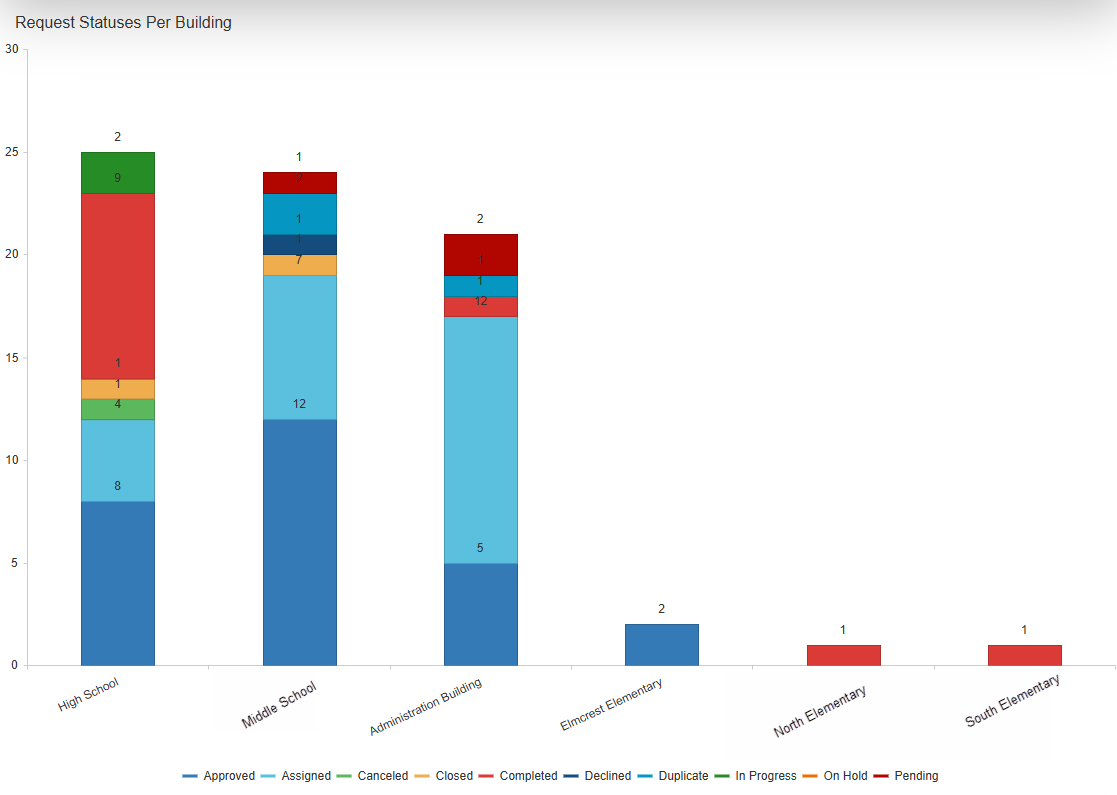
| Request statuses per building |
|
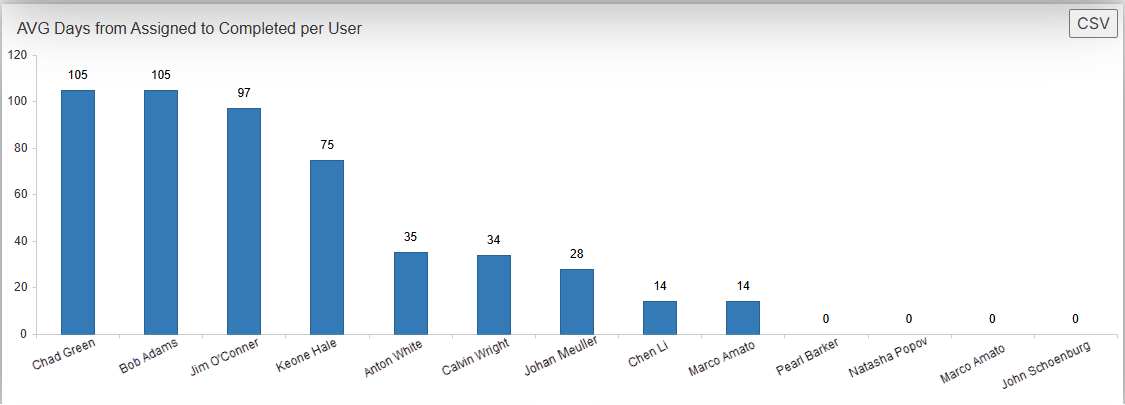
| Average days from assigned to completed per user |
|
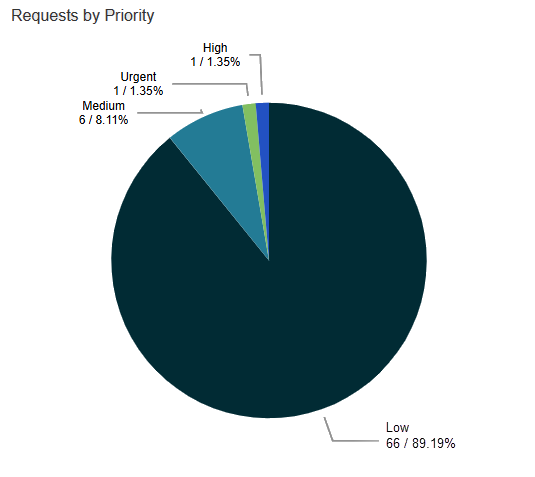
| Requests by priority |
|
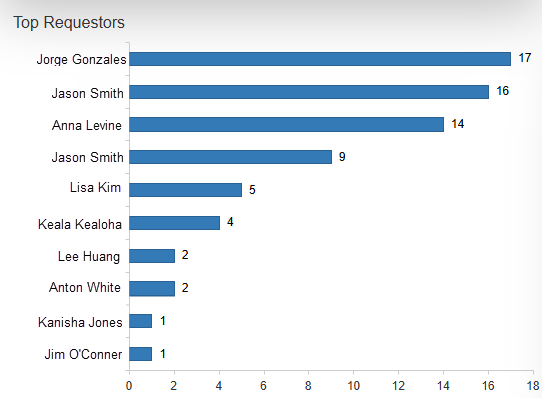
| Top requestors |
|
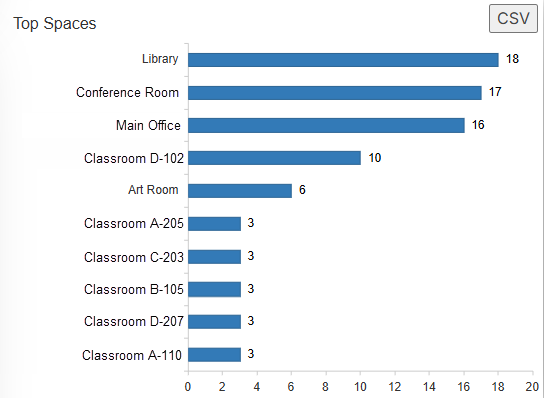
| Top spaces |
|
Create a PDF
- Select Reports > Request Summary Dashboard.
- Set any filters you want.
- At the top of the page, select Print Charts.
