Use your Dashboard page
The Dashboard is visible to all users. The widgets you see and actions you can take are based on your user permissions.
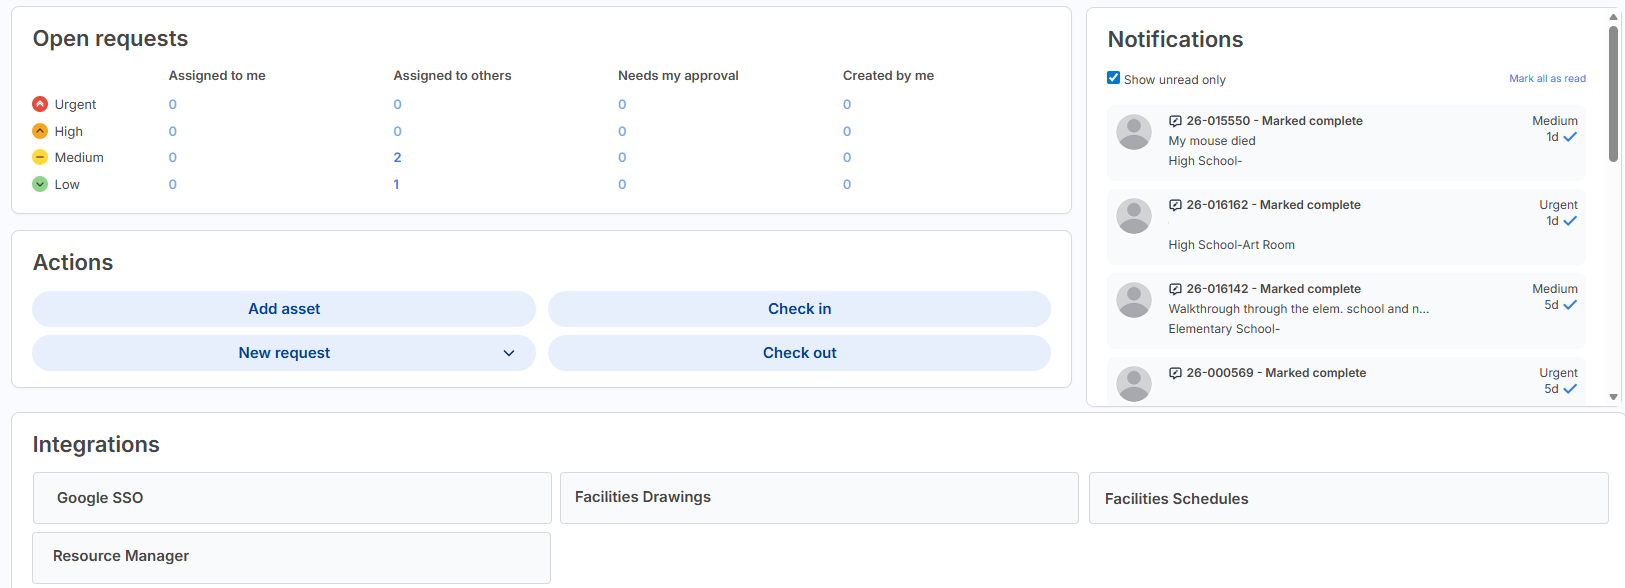
Open requests widget
The Open requests widget shows all open requests you have access to based on your permissions.
You may see some or all of the following columns in the Open requests widget, also based on your permissions:
| Column | Associated permission | |
|---|---|---|
| Assigned to me | Can Be Assigned WOs | |
| Assigned to others | Can Be Assigned WOs or Assign WO to Others | |
| Needs my approval | Approve on Behalf of Others or Approve WOs, and the request is pending their approval | |
|
Created by me
|
Submit Work Order |
The Priority column is based on the Priority Field Visibility setting on the Manage Request Types page.
-
If the setting is set to Admin Only, you need either the Edit WOs or Assign WO to Others permission; otherwise, Priority is hidden and everything is in one row.
-
If the setting is set to Admin and Assignee Only, you need the Edit WOs, Assign WO to Others, or Can Be Assigned WOs permission; otherwise, Priority is hidden and everything is in one row.
-
If the setting is set to All Users, all users will see the priority.
Actions widget
You may see some or all of the following buttons in the Actions widget:
| Action button | Associated permission |
|---|---|
|
Add asset Opens a new browser tab, and the Manage Asset page appears. |
Add Asset |
|
Check in Opens a new browser tab, and the Quick Circulation page appears. |
Edit Assigned User |
|
Check out Opens a new browser tab, and the Quick Circulation page appears. |
Edit Assigned User |
|
New request The request type drop-down appears, showing only request types you have access to in your role. |
Submit Work Order |
If you do have any of the above permissions to see the buttons, the panel doesn't appear.
Notifications widget
You can quickly see your notifications in the Dashboard. This is the same as clicking the notification bell in the header. You can choose to show unread notifications only, and mark all of them as read.
Any emails and/or texts you receive for requests and other product-related notifications (such as for assets, checking in, checking out, and inventory requests) will also appear.
Integrations widget
If your district has integrations and you have the Manage Site Settings administrative permission, you will see all active integrations.