View the Total Cost Dashboard
The Total Cost Dashboard shows several data points at a glance. From any of the bar, column, pie, and line charts, you can drill down to get the information you need. You can also export the data to a PDF to save and share the data.
To view the Total Cost Dashboard:
Select Reports > Total Cost Dashboard.
To filter your results:
You can show a subset of data by clicking a section of either a pie chart or graph. All information within the report adjusts accordingly.
You can also use the filters on the upper-left side of the page.
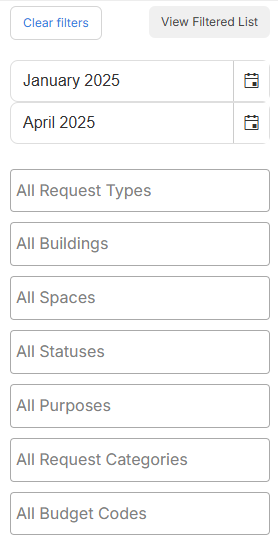
Click the filter you want, and then select from the drop-down.
|
Note: The date filter defaults to the last three months. Data is available for the past 15 months. |
The filter results appear in all charts and graphs.
The Total Cost Dashboard includes:
| Data | Related widget |
|---|---|
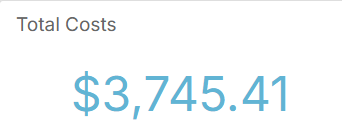
|
Total costs |
|
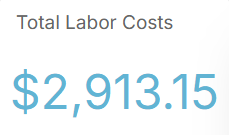
|
Total labor costs |
|
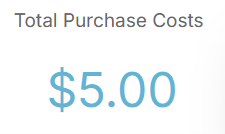
|
Total purchase costs |
|
|
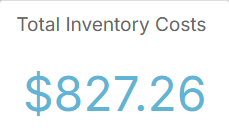
Total inventory costs |
|
|
Total costs per month |

|
|
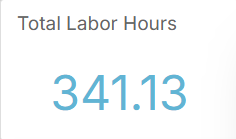
Total labor hours |
|
|
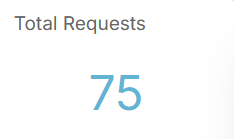
Total requests |
|
|
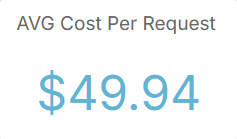
Average cost per request |
|
|
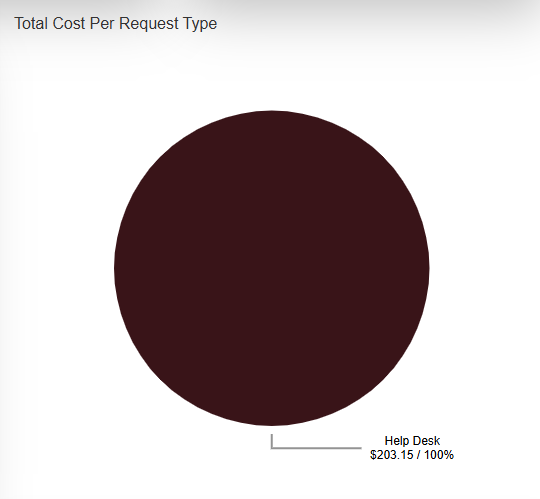
Total cost per request type |
|
|
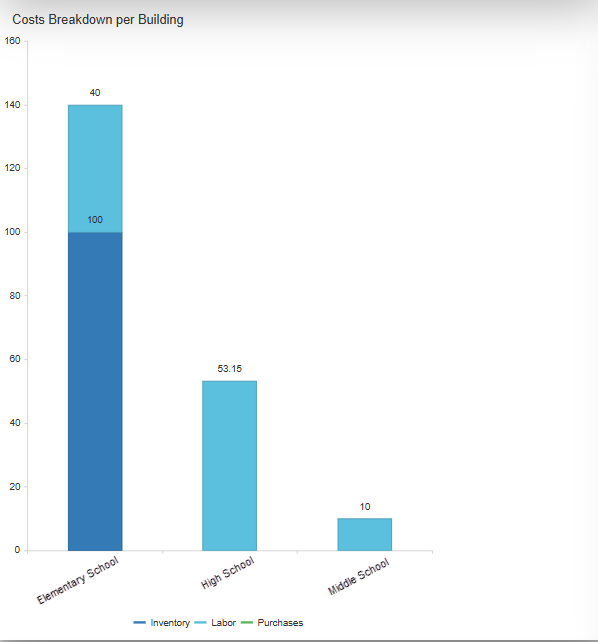
Costs breakdown per building |
|
|
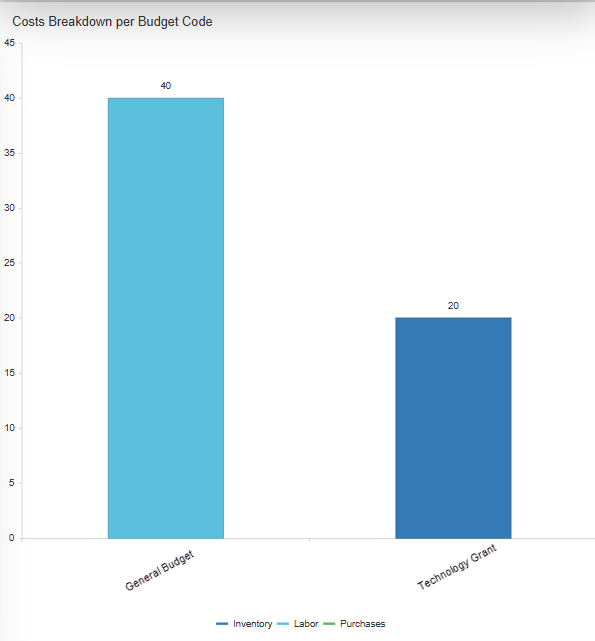
Costs breakdown per budget code |
|
|
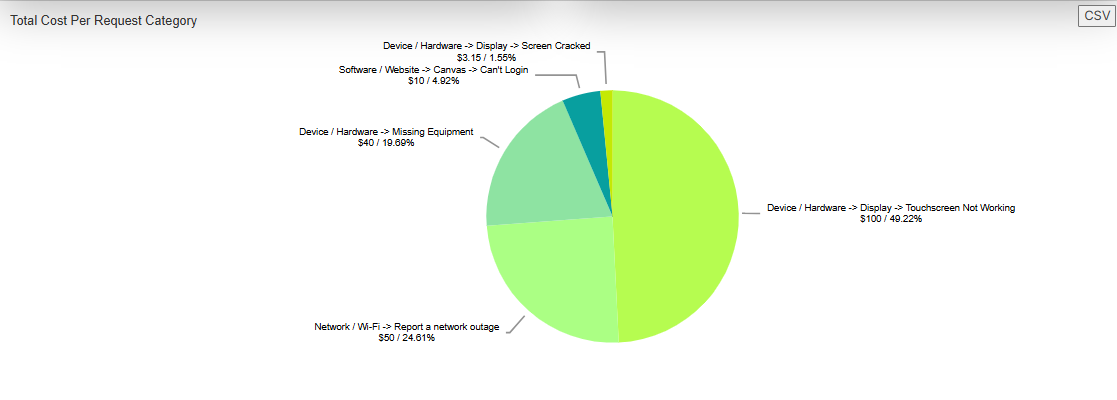
Total cost per request category |
|
Create a PDF
- Select Reports > Request Summary Dashboard.
- Set any filters you want.
- At the top of the page, select Print Charts.
