Use your Dashboard page
The Dashboard menu option is visible to all users. Depending on user permissions, you will see either the Requestor view or the Administrator view.
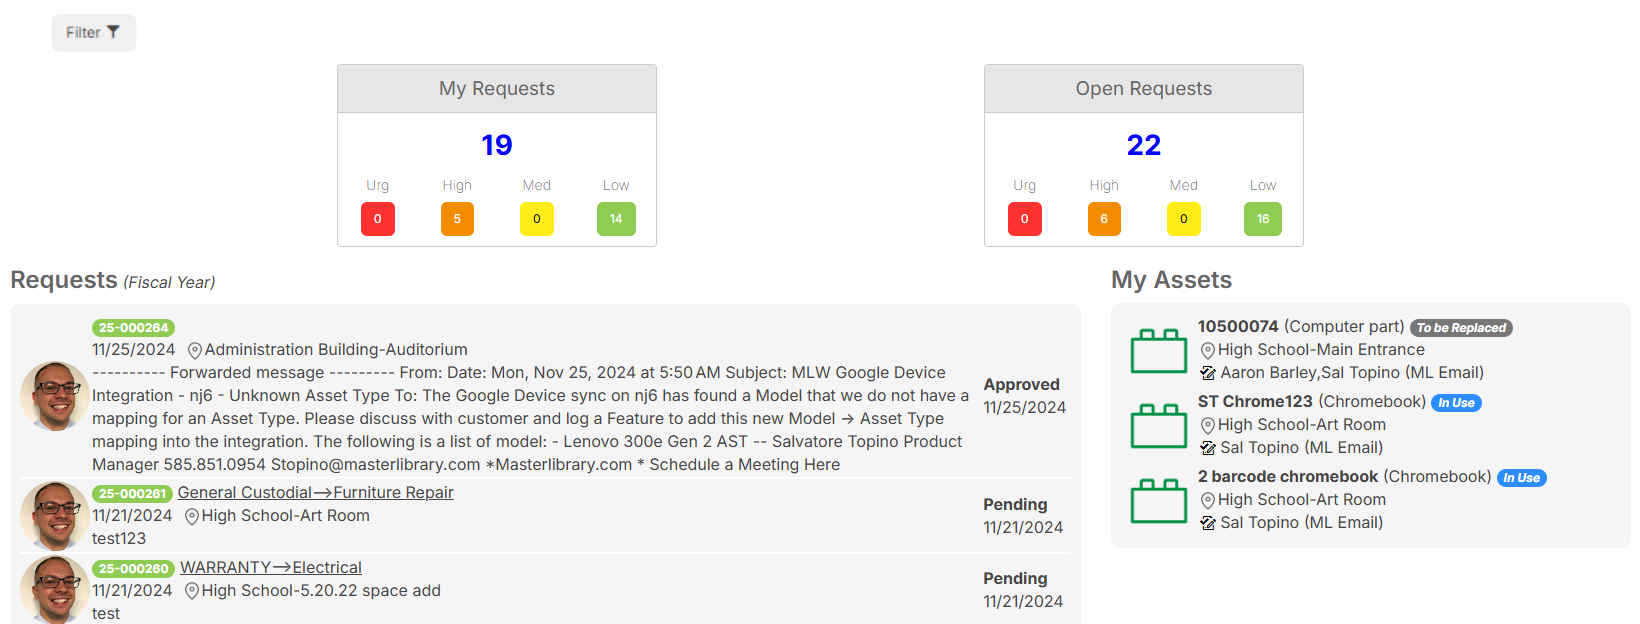
Requestor view
| Dashboard section | Description |
|---|---|
| My Requests |
Shows a count of all requests you have submitted. |
| Open Requests | Shows a count of all open requests you are associated with. |
| Requests |
Shows the 10 most recently submitted requests for the current fiscal year. |
| My Assets | Shows resources currently assigned to you. |
|
Notes:
|
To filter your results:
You can show a subset of data by clicking a section of either a pie chart or graph. All information within the report adjusts accordingly.
You can also use the filters on the upper-left side of the page.
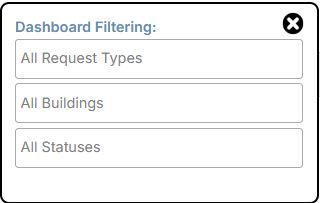
To filter requests by priority, click a colored priority button. To remove a filter, click the priority button again.
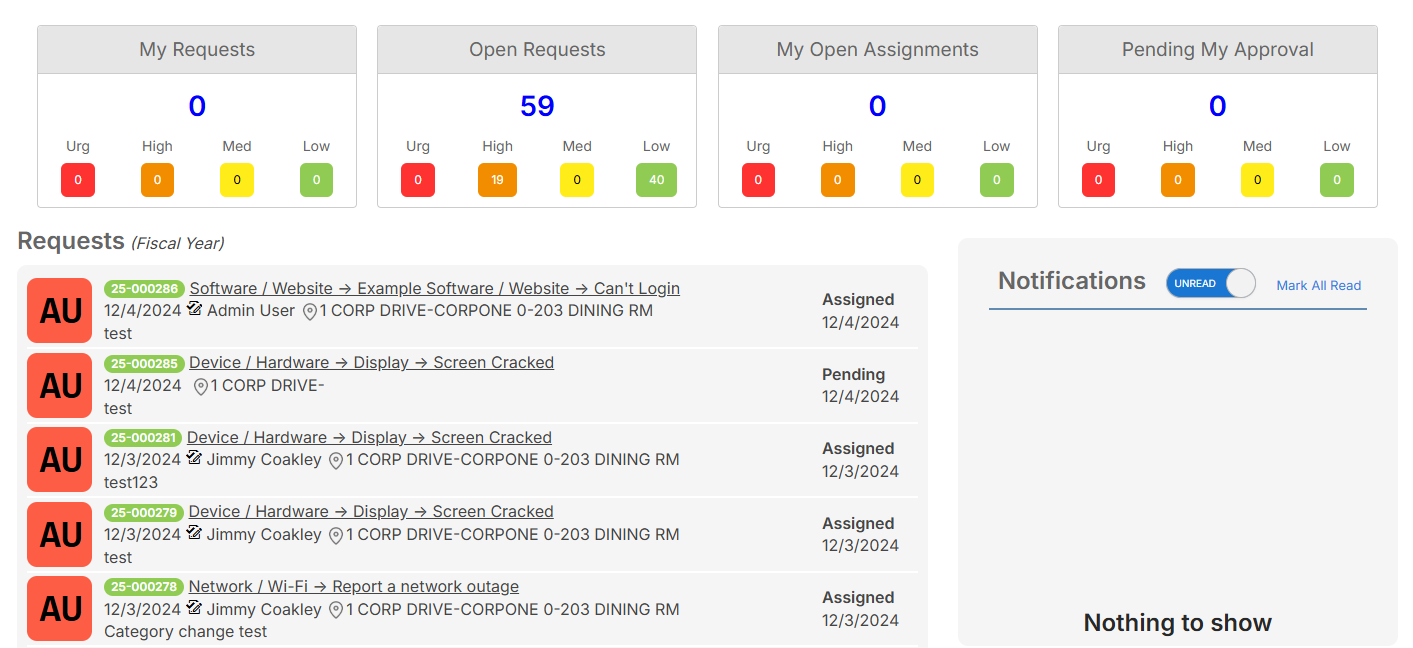
Administrator view
| Dashboard section | Description |
|---|---|
| My Requests |
Shows a count of all requests you have submitted. |
| Open Requests | Shows a count of all open requests you are associated with. |
| My Open Assignments | Shows a count of all open requests assigned to you. |
| Pending My Approval | Shows a count of all requests needing your approval. |
| Requests |
Shows the most recently submitted requests for the current fiscal year. |
| Notifications | Shows the most recent system-generated email and text notifications. |
|
Notes:
|
To filter your results:
You can show a subset of data by clicking a section of either a pie chart or graph. All information within the report adjusts accordingly.
You can also use the filters on the upper-left side of the page.
To filter requests by priority, click a colored priority button. To remove a filter, click the priority button again.